TL;DR
As first and only designer, I designed the experience that took Synq from demo to winning deals against the incumbent leader of the space.
Role: Lead Product Designer Duration: 2 years
Context
Over the 2 years I worked with Synq, I solved problems for a variety of data engineering workflows. From detecting errors in gigantic systems of databases, to making it easier to understand how such databases were connected. A lot of these solutions were new to the market and superior to those of the incumbent enterprise players.
- Navigating giant data warehouses
- Tracking groups of business-critical tables
- Orchestrating multiple systems into a simple Slack integration
- Navigating giant data warehouses
- Tracking groups of business-critical tables
- Orchestrating multiple systems into a simple Slack integration
Navigating giant data warehouses
Mid to large companies rely on humongous amounts of data. Such data in stored in tens of thousands of interconnected tables. There’s 3 big problems that this causes:
- It can take data engineers hours to find errors when they happen.
- It’s incredibly difficult to understand how the data flows from one table to another. Also referred to as data dependencies.
- In a lot of cases, there’s so much data that the browser crashes.
By closely working with the front-end and back-end engineers at Synq, I designed tools to solve those 3 problems quite elegantly.
What I did
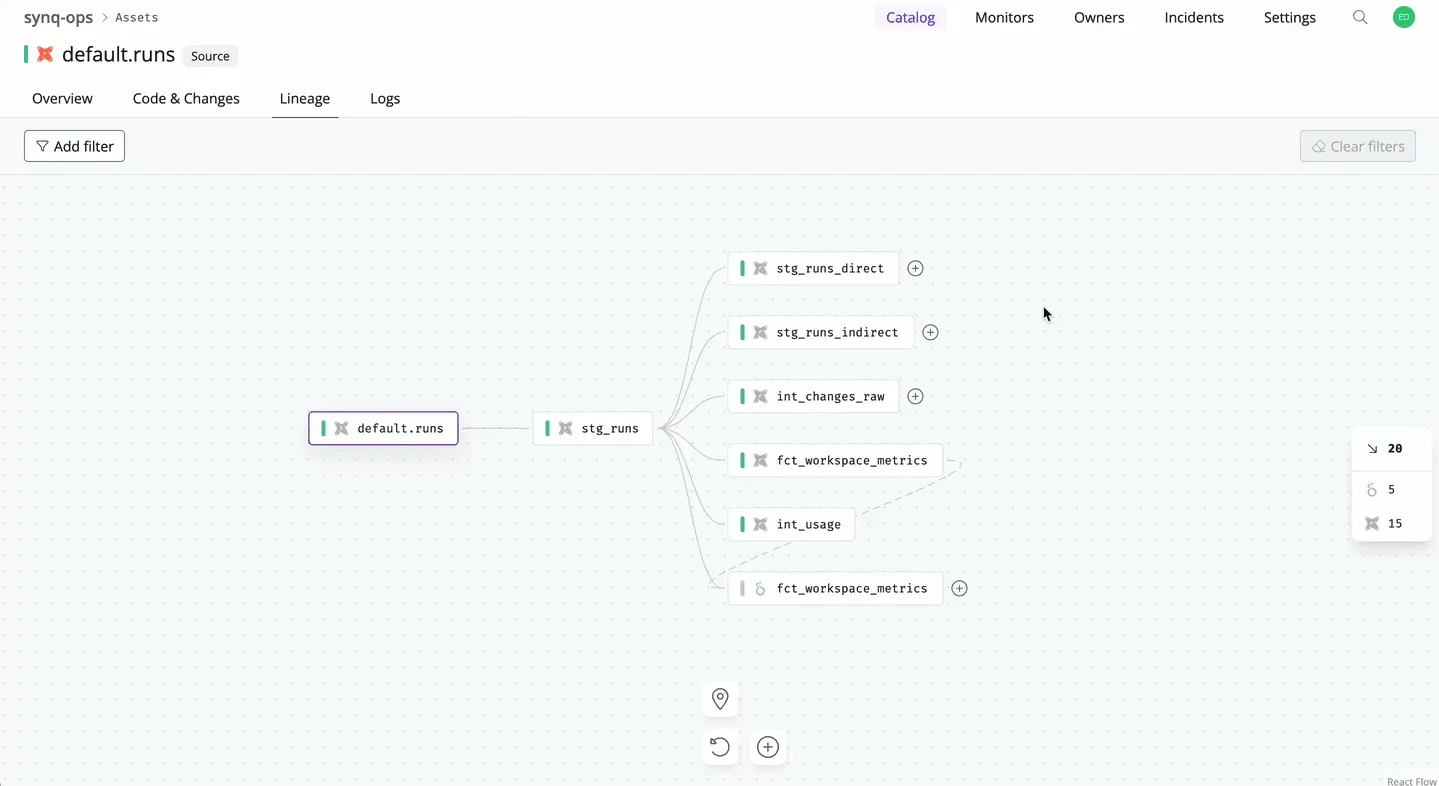
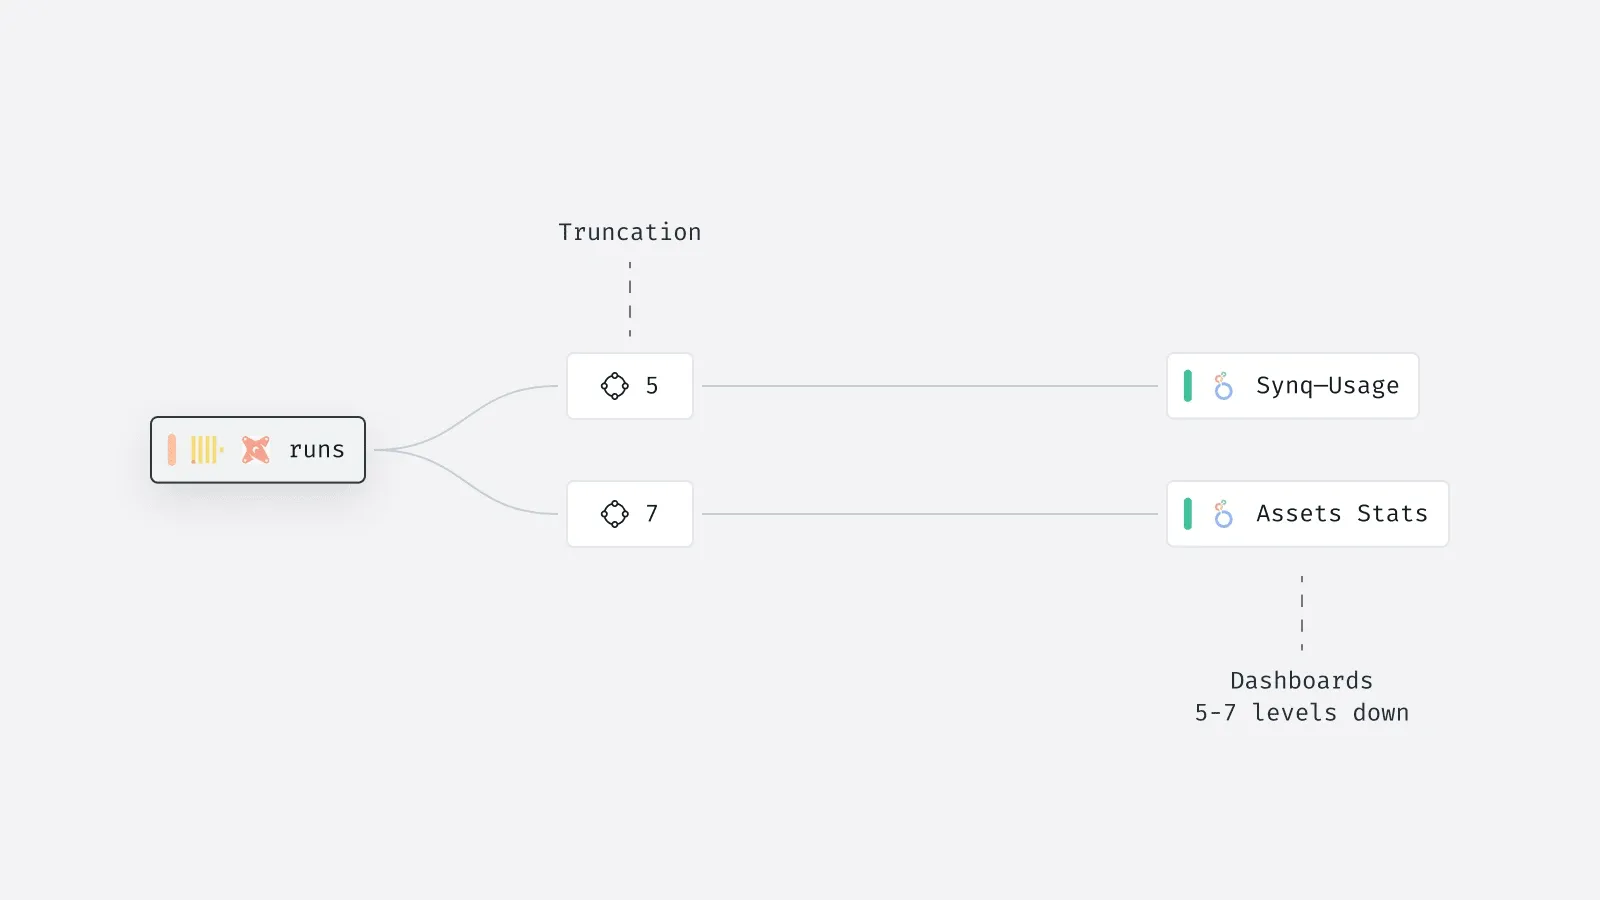
To better understand how the data flows, I designed several innovative interaction patterns that hide away non-essential controls and information.
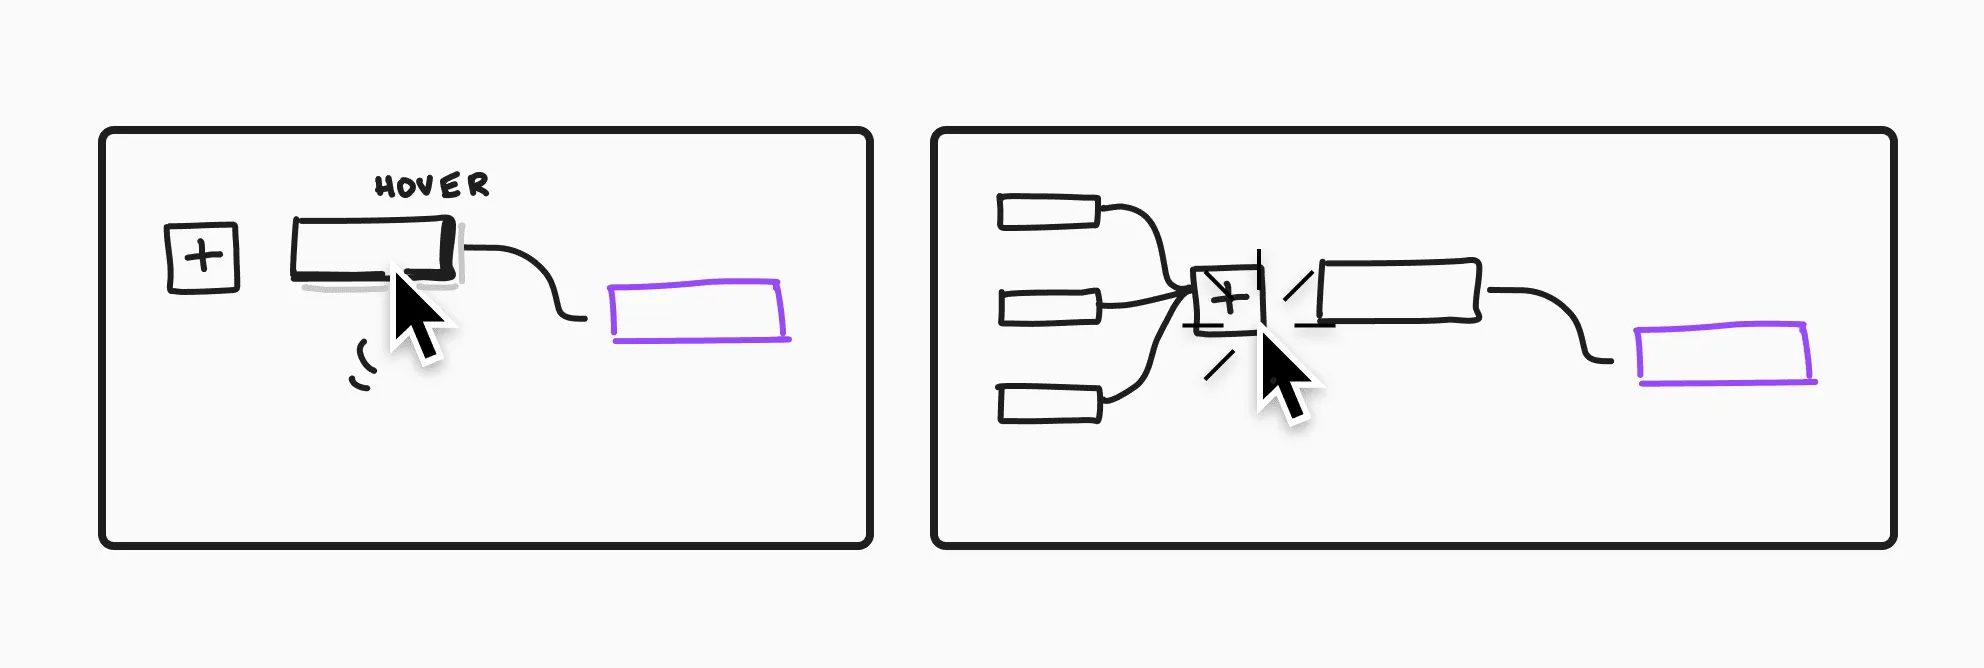
This helped users better process the amount of complexity but also dramatically reduced the amount of browser memory required, preventing it from crashing.
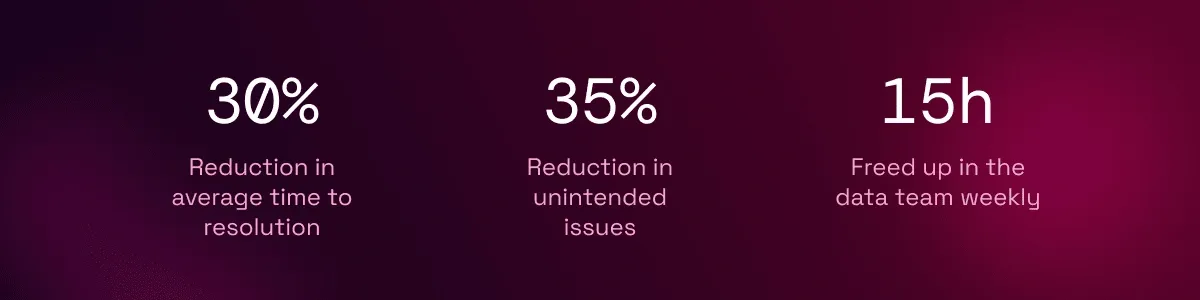
This information combined save data teams 15 hours or work a week on average, compounding to up to 20 weeks of time.
“SYNQ’s automated data lineage has been a game-changer. It has significantly reduced the time we spend tracing data lineage, allowing us to focus more on analysis and insights.
We are much faster at identifying the root cause of data discrepancies. We recently corrected a significant reporting error impacting our sales forecasts. This correction led to more accurate forecasting and better strategic decisions
Tracking groups of business-critical tables
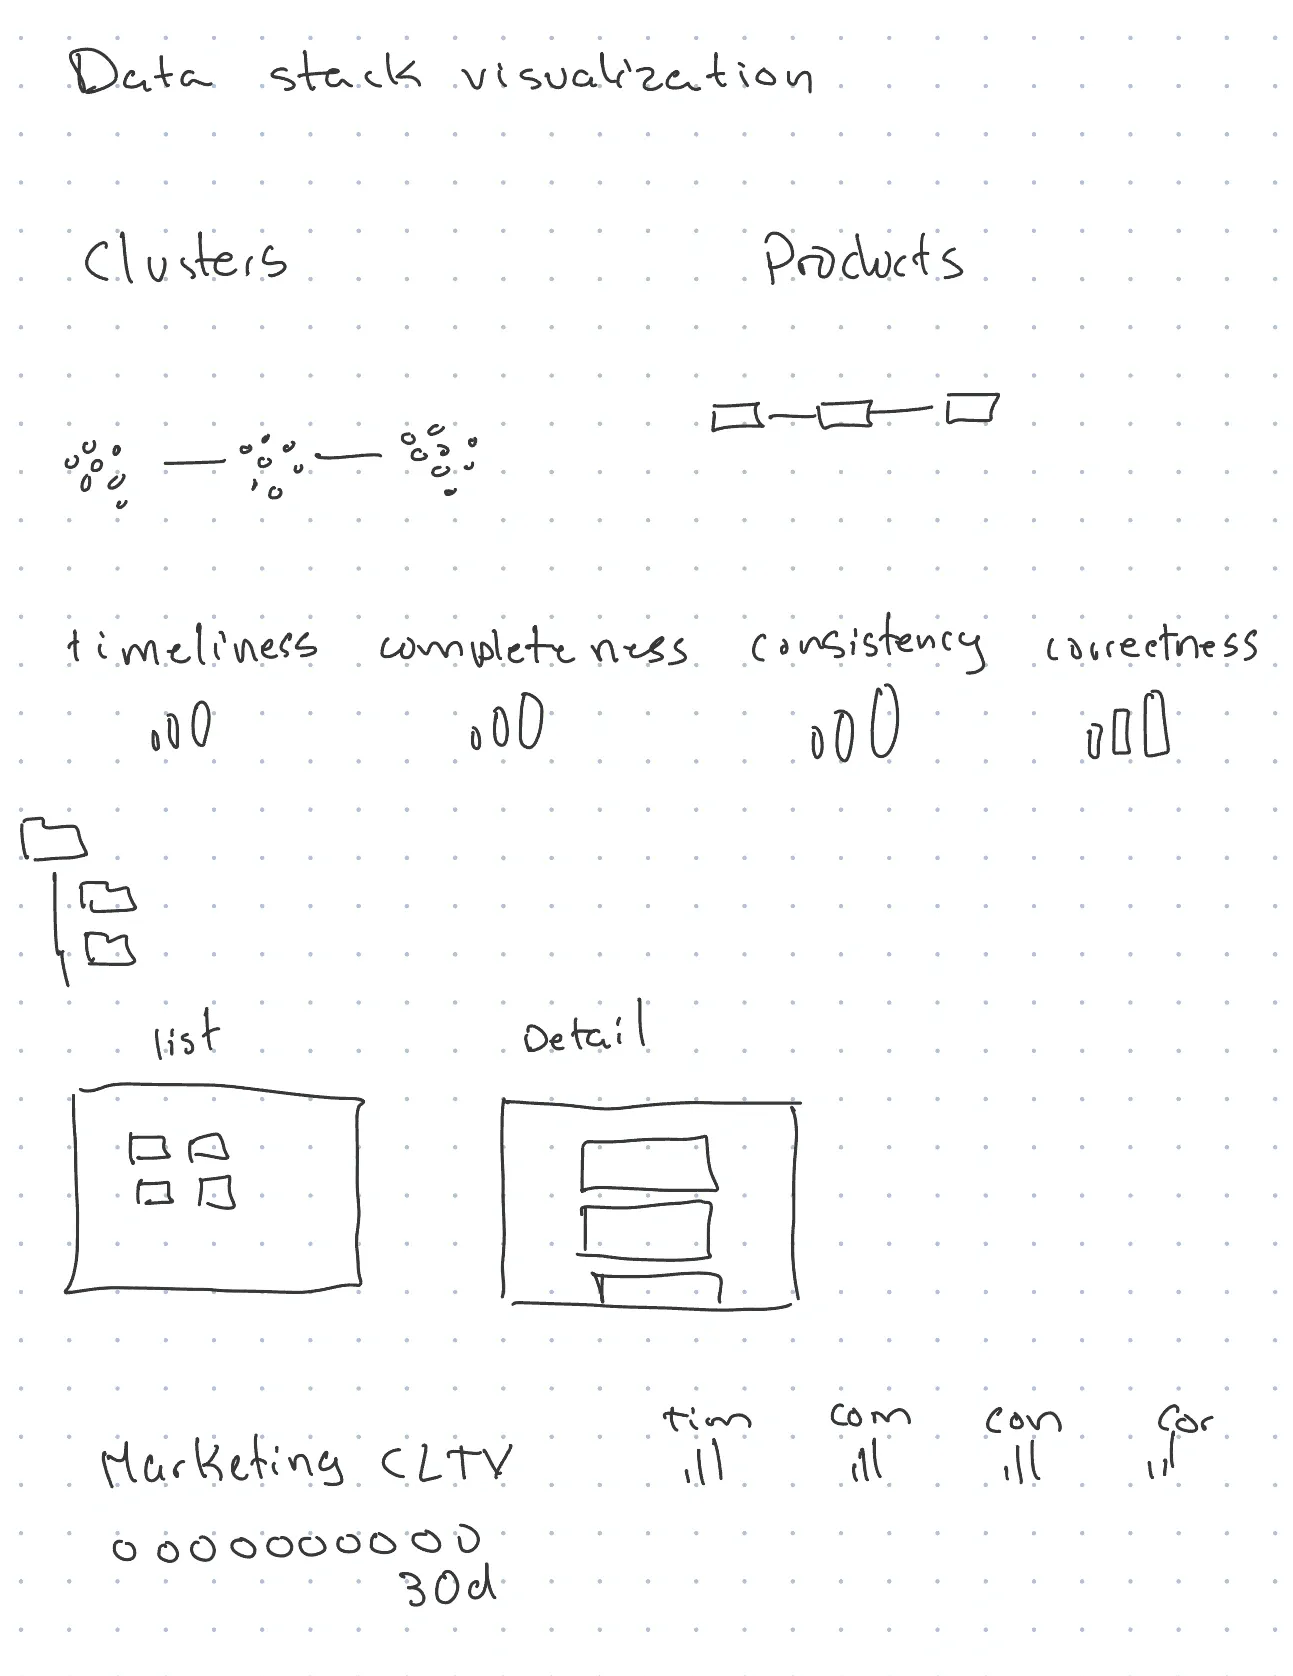
Among the tens of thousands of tables businesses have, there’s always clusters of tables upon which the whole operation depends. Making sure these clusters are free of errors is a priority for data teams.
What I did
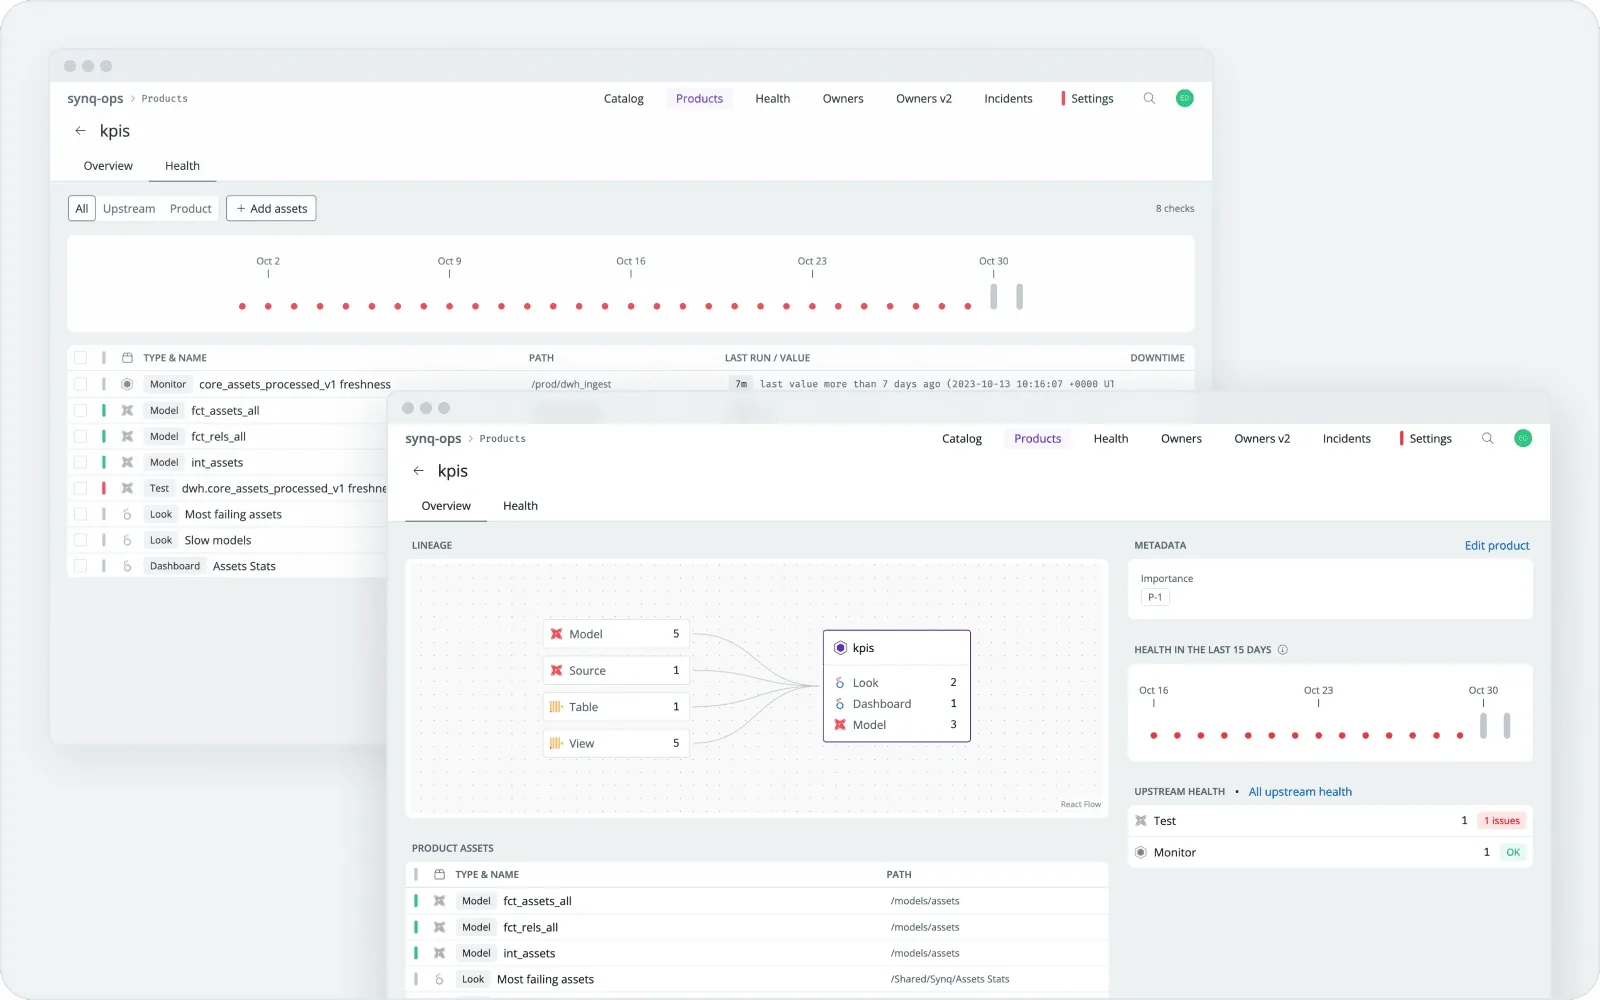
With the help of CEO and some very kind customers, we created a way to represent the critical clusters of data into easier to track groups.
We called them data products.
Synq was the first company to productize the data products and competitors soon followed.
Data products make it a lot easier to track critical errors and maintain a threshold of quality in the entire data warehouse.
“Data products have become the backbone of our entire data operations – from managing where we place monitors, to how we define and activate ownership, and look back on metrics to systematically improve our data quality”
”We recently moved a “black box” critical finance model into dbt. Since then, everyone can see all dependencies in the lineage and we’ve reduced the time it takes to build the model from 8 hours to 1 hour helping us save money and reduce the time to insight”
Orchestrating multiple systems into a simple Slack integration
Despite the complexity that Synq packs under the hood, my approach was always to make things are simple as a consumer app as possible. We knew that the majority of our customers used Slack for their daily communications. This is where the data team coordinates the resolution of data incidents. It made complete sense to allow them to interact with Synq directly from Slack.
What I did
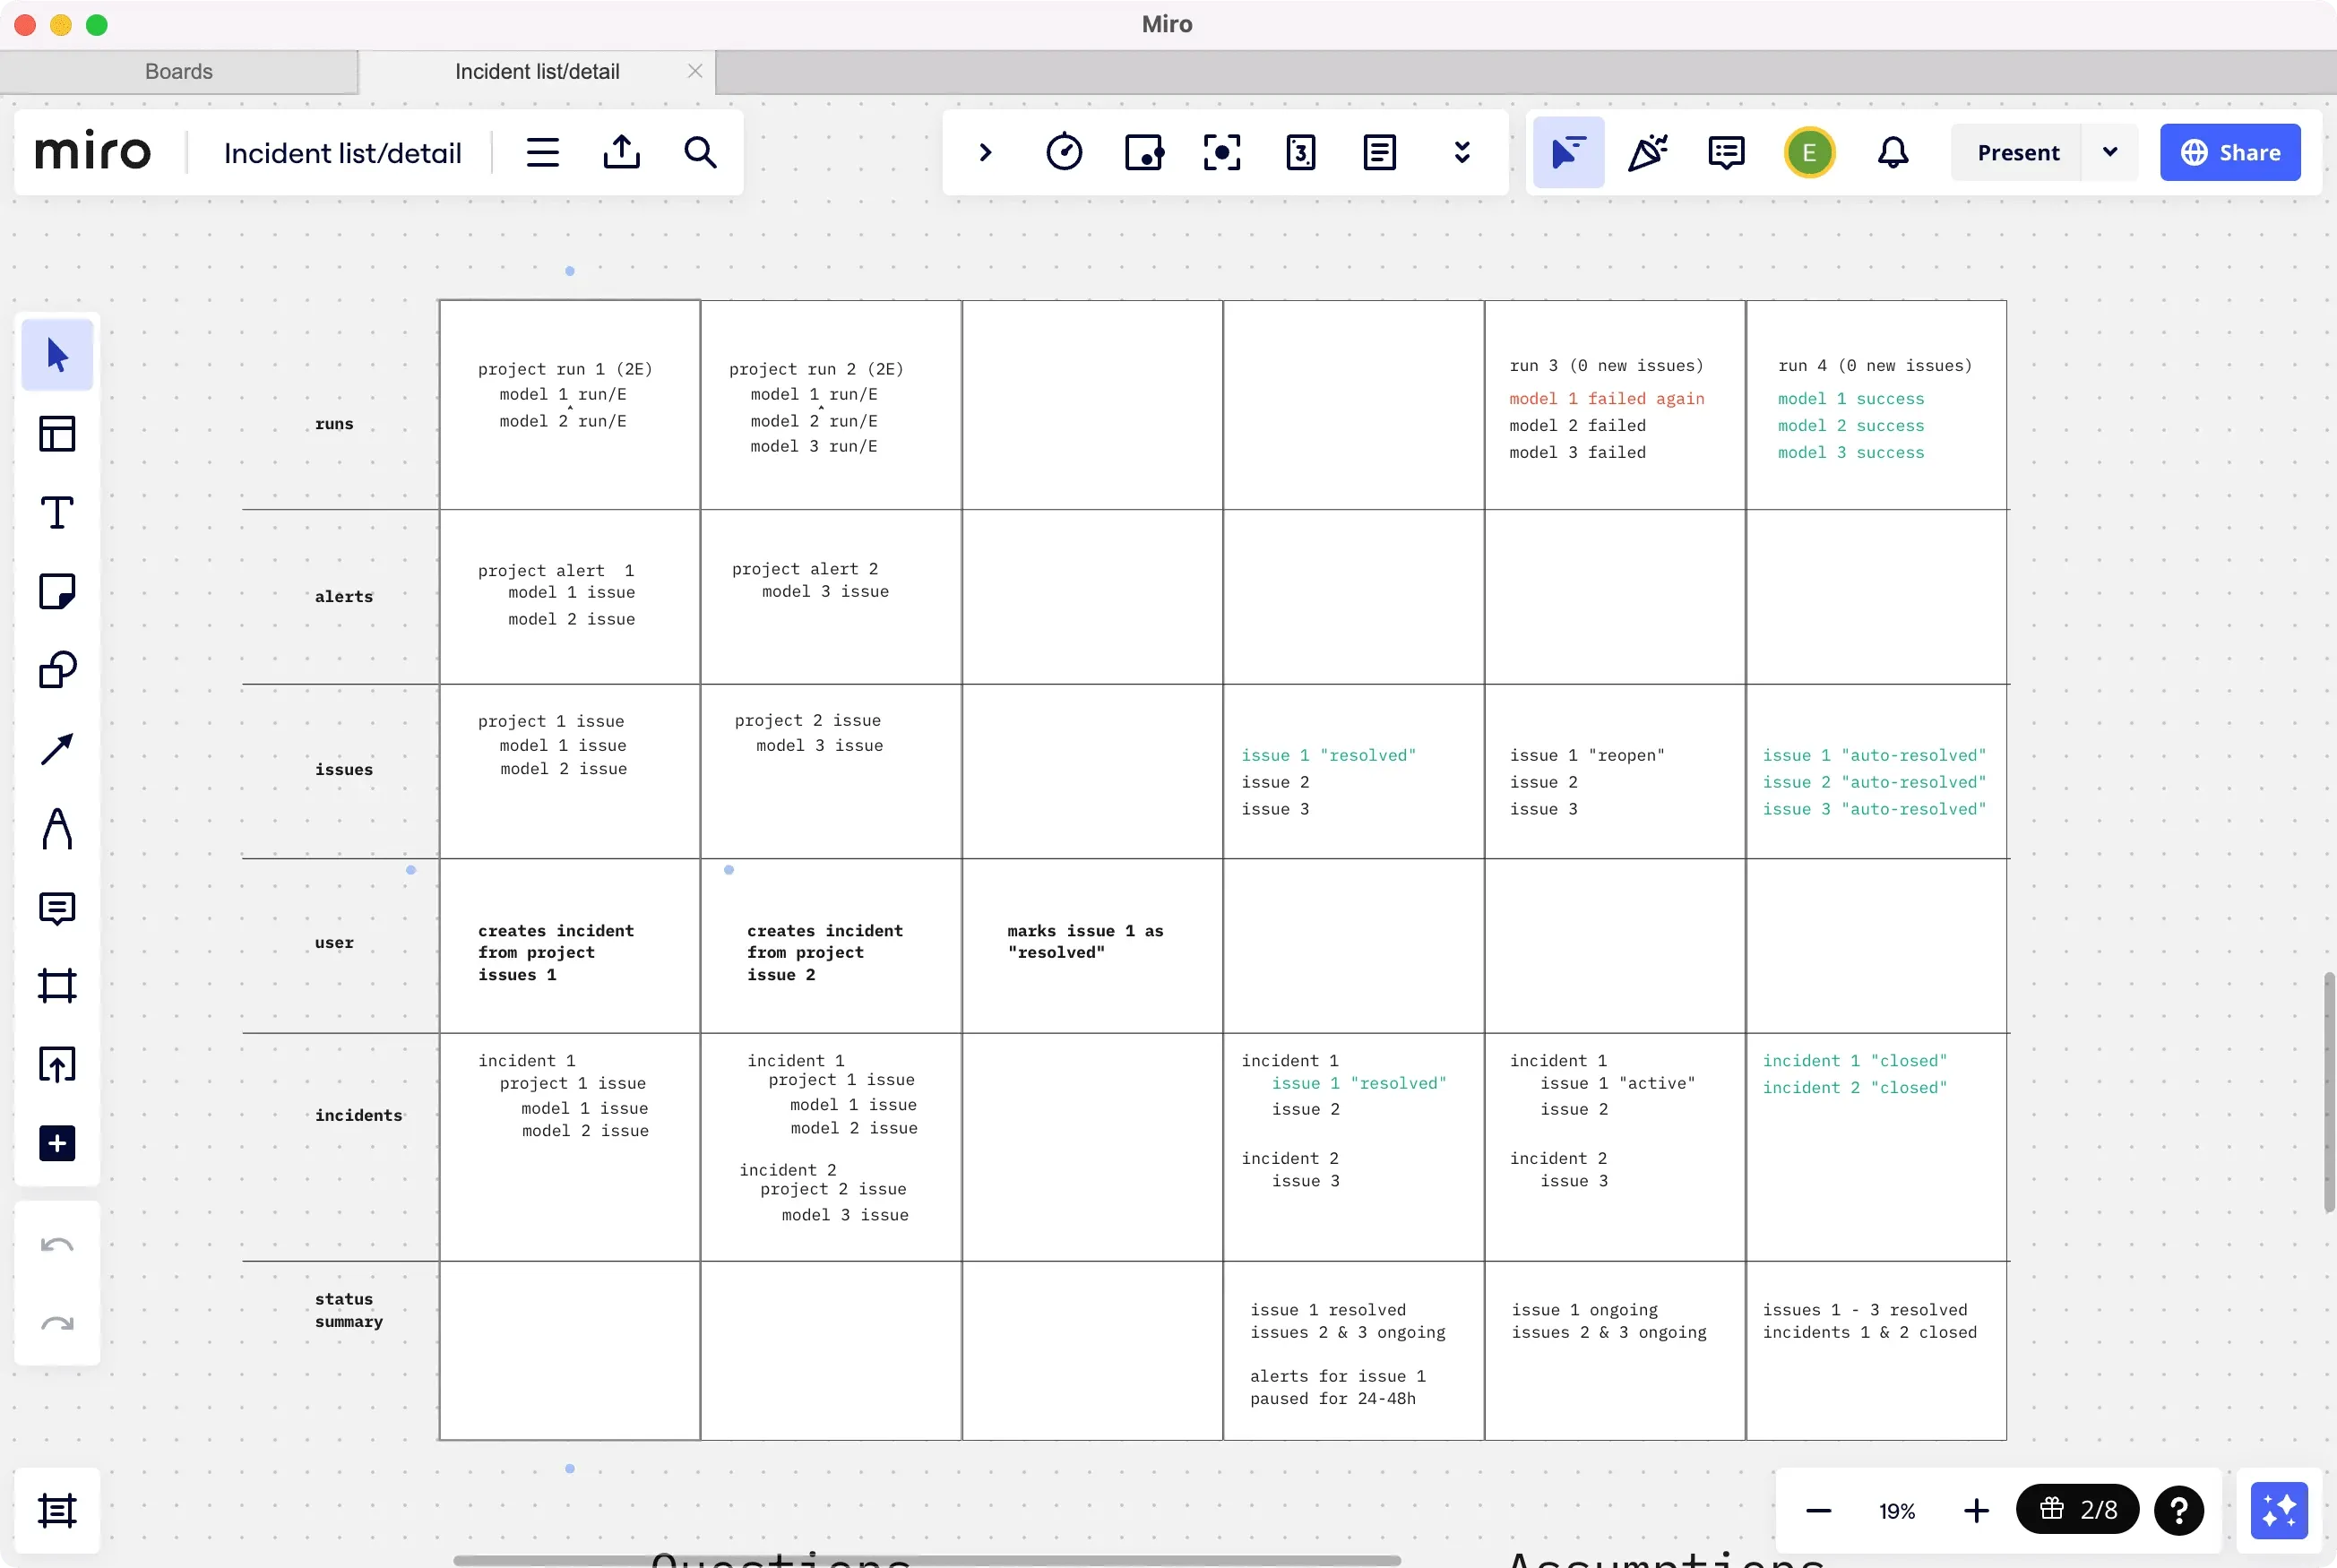
Together with our back-end engineers, I designed a way for users to get notified of issues directly in the Slack channel of their choosing. Whenever they received a notification, they could click to learn more in Synq’s web app, or declare as an incident.
“Our previous data reliability provider was focused on integrating with as many tools and being as configurable as possible. A side effect of this was that it became really hard to use. We didn’t use 90% of the features and always questioned if we had the best setup. SYNQ is opinionated by default and pushes us into best practices.”